How we validated if logging was easy and AI insights were useful
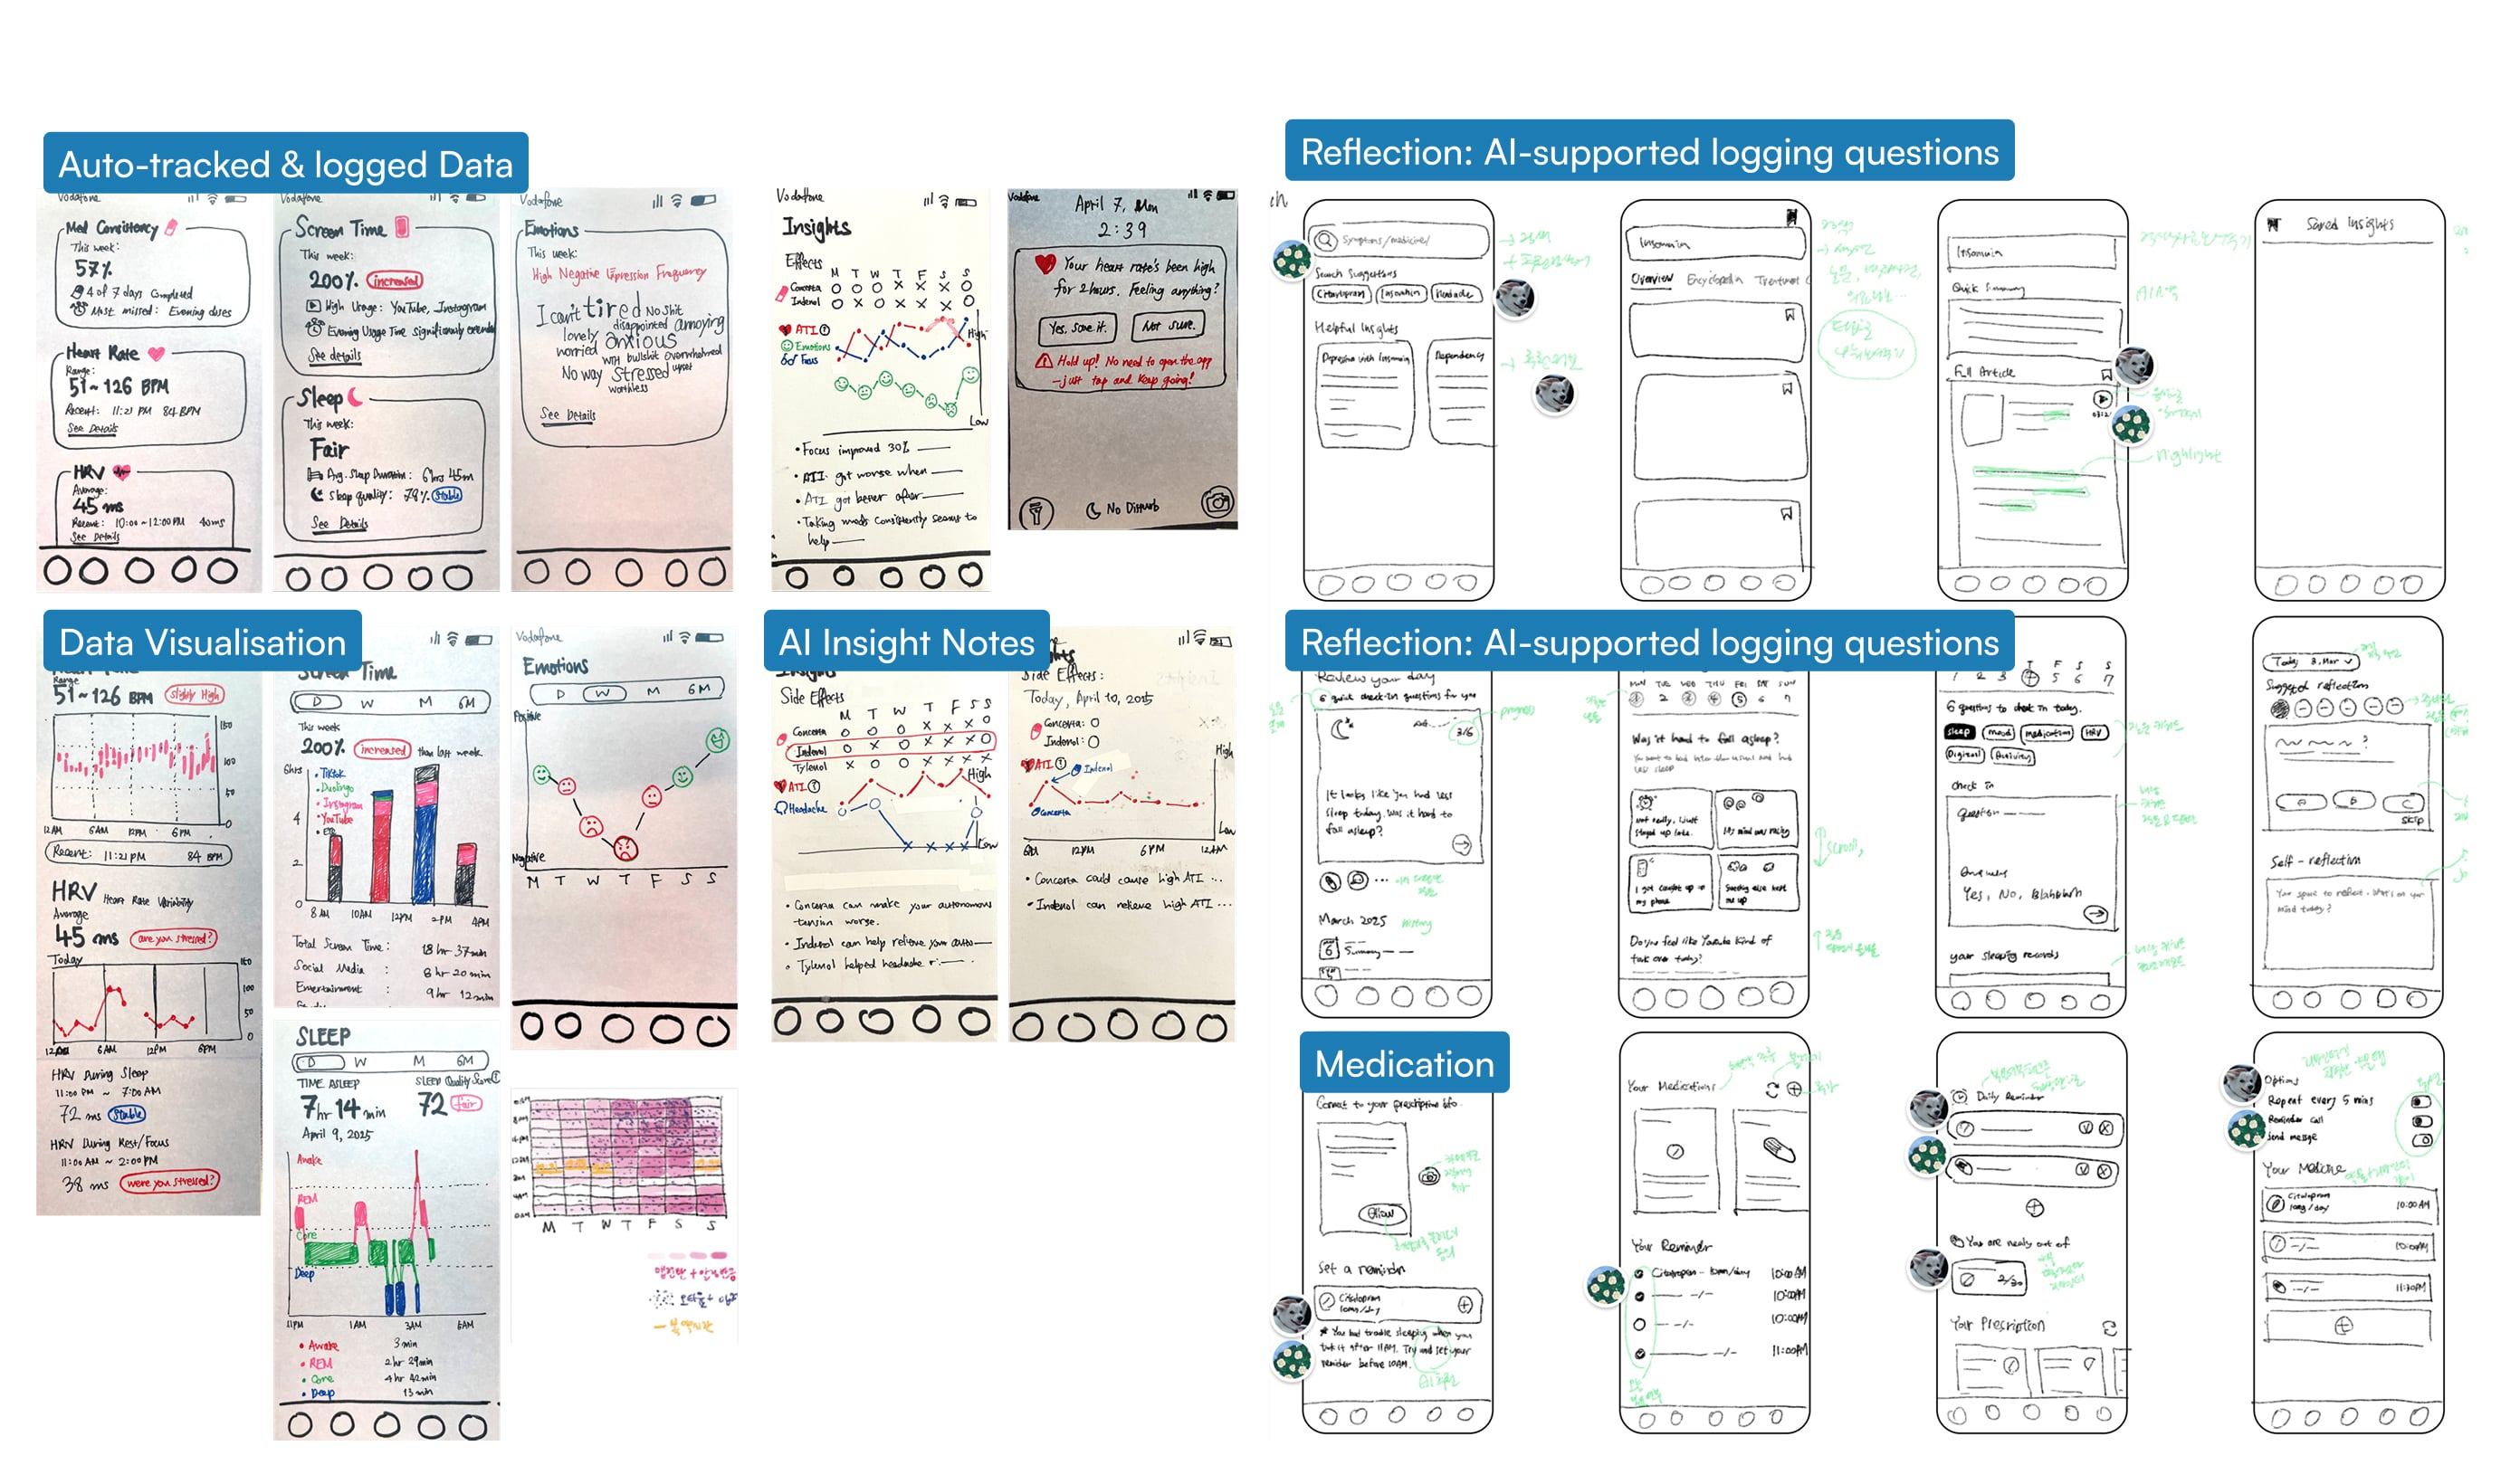
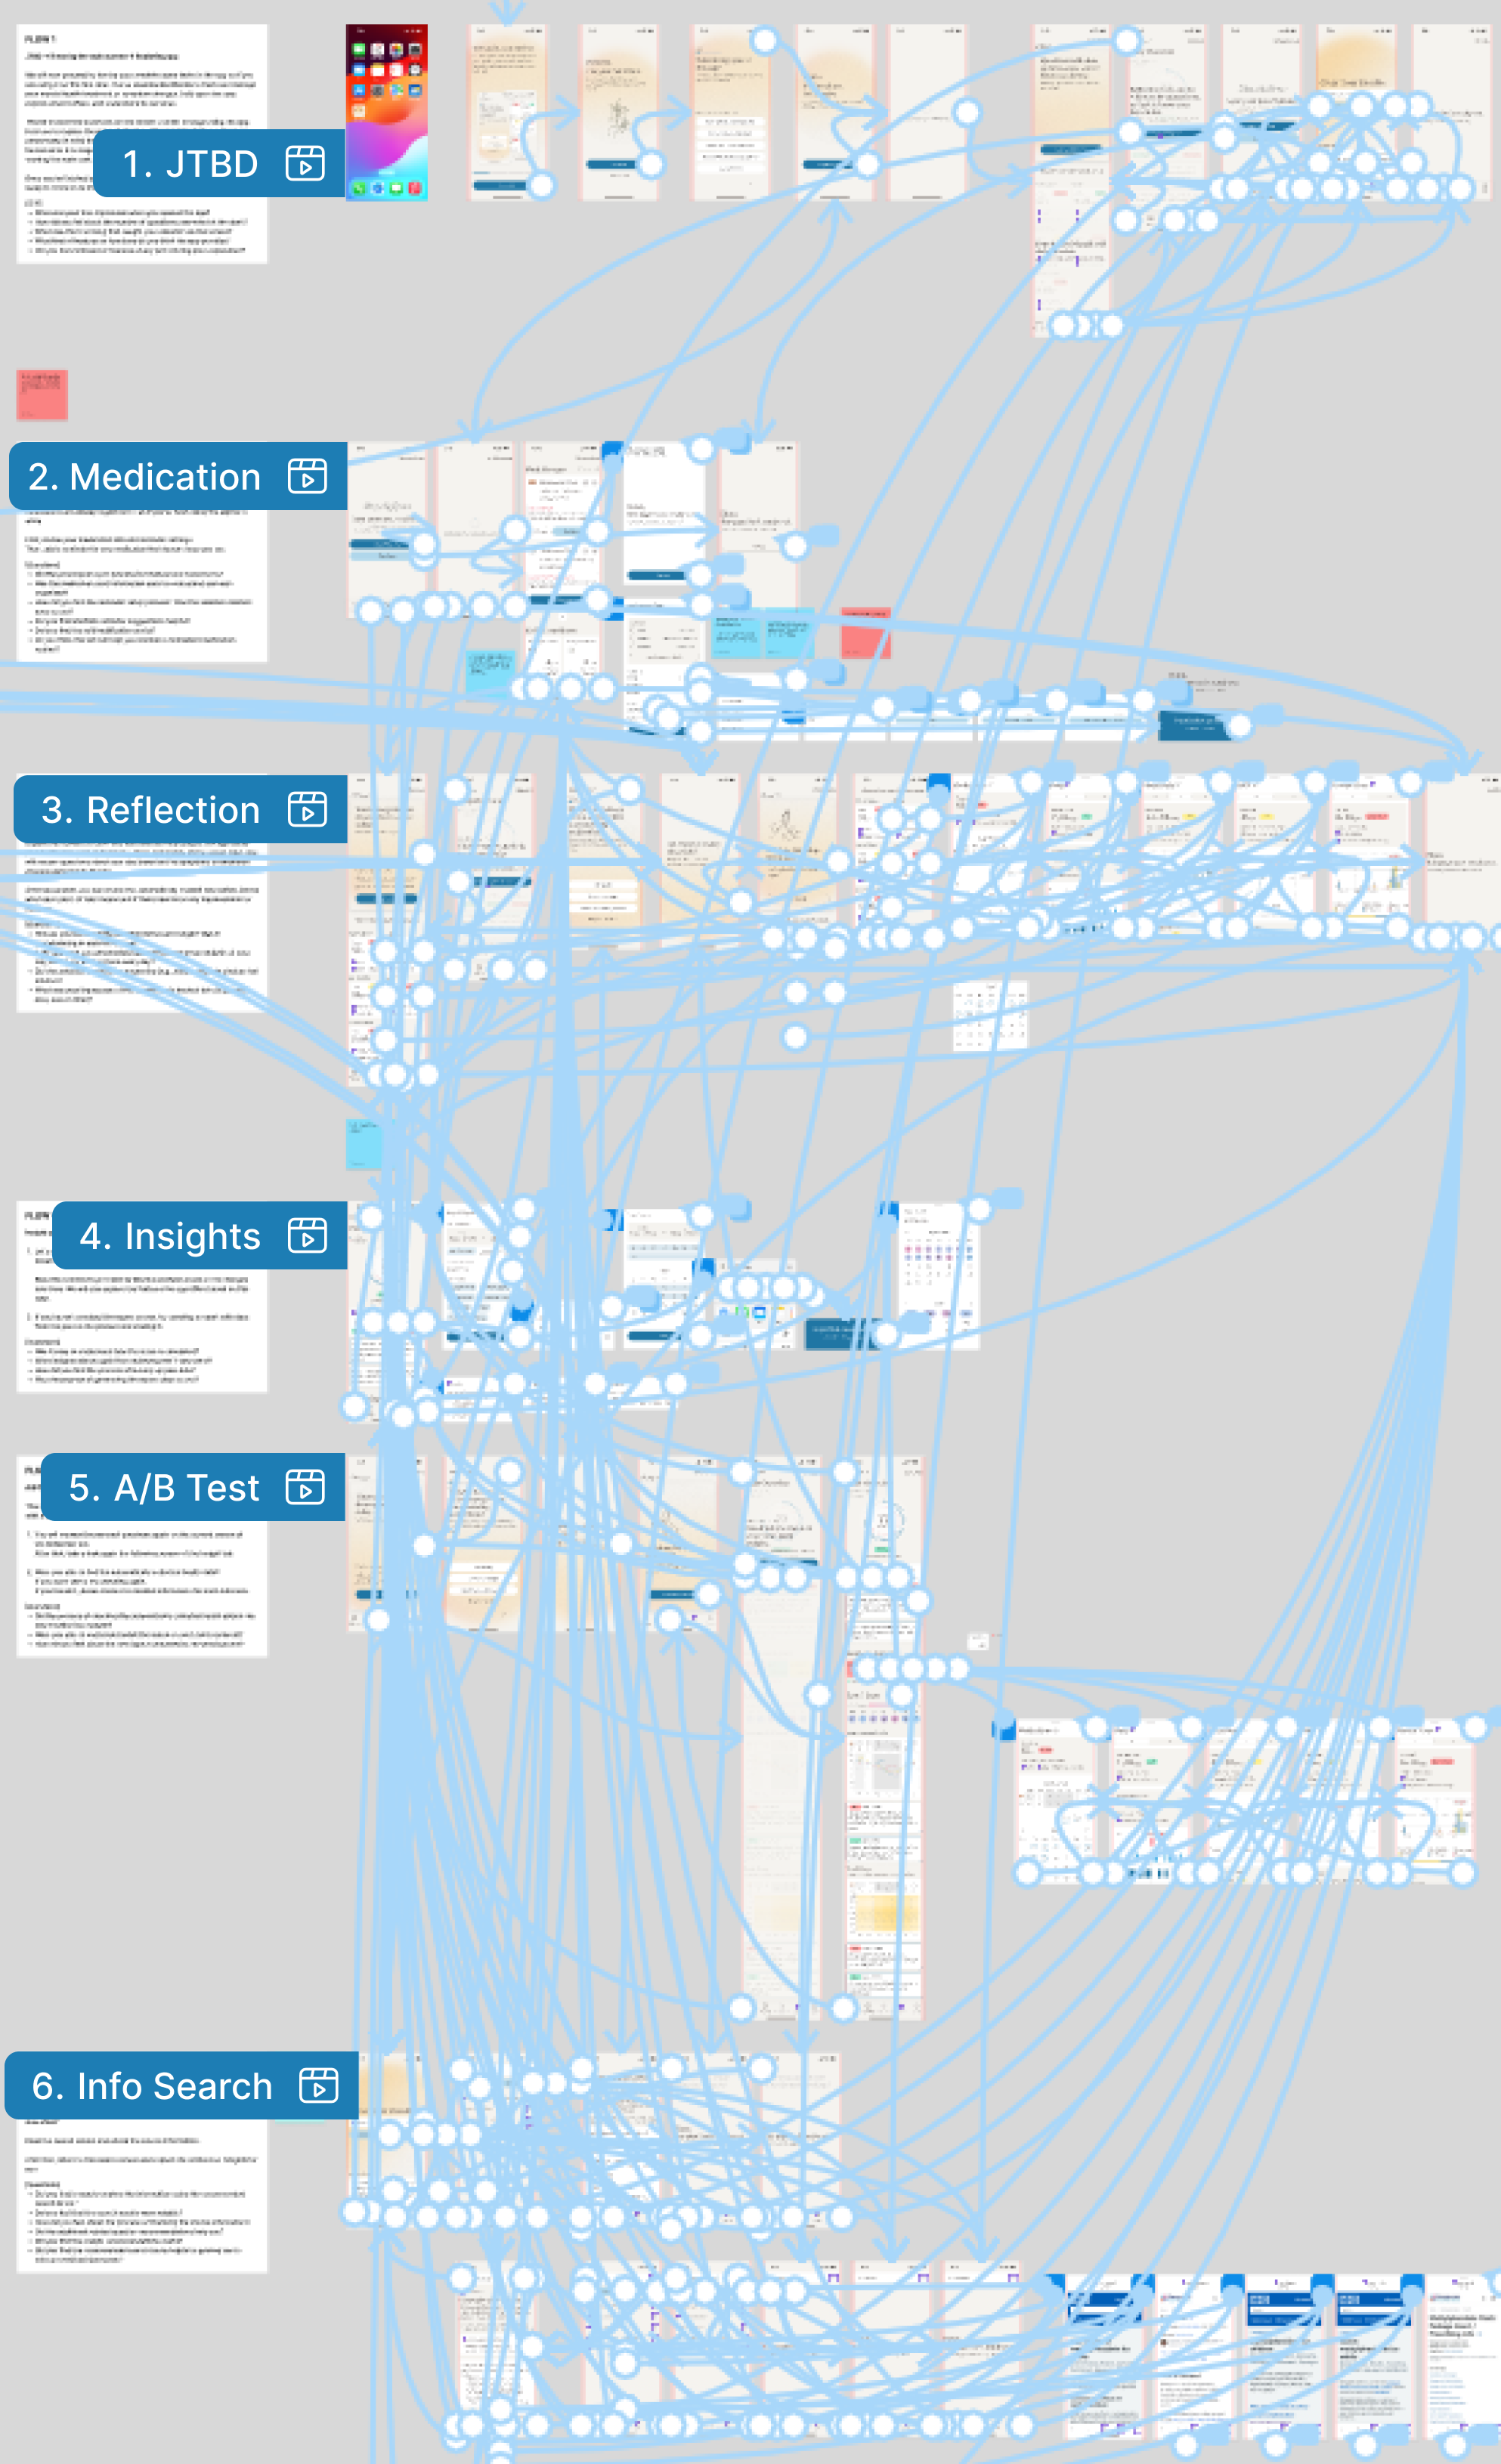
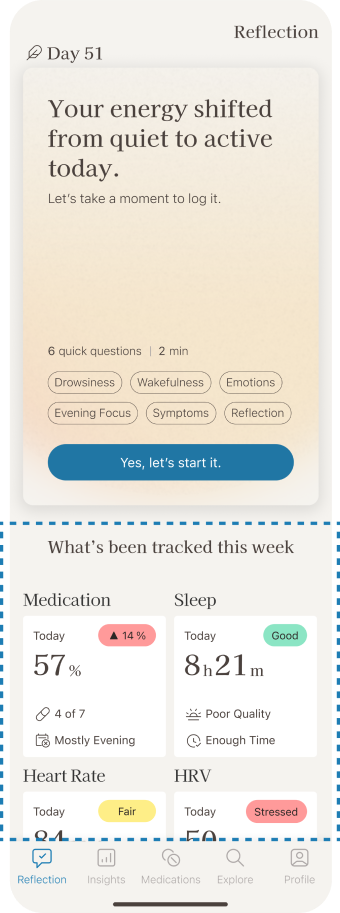
We conducted UT with 20-30s users diagnosed with depression, anxiety, or ADHD. We designed a workflow that mirrored the actual user journey, from onboarding and daily logging to reviewing AI-generated insights.
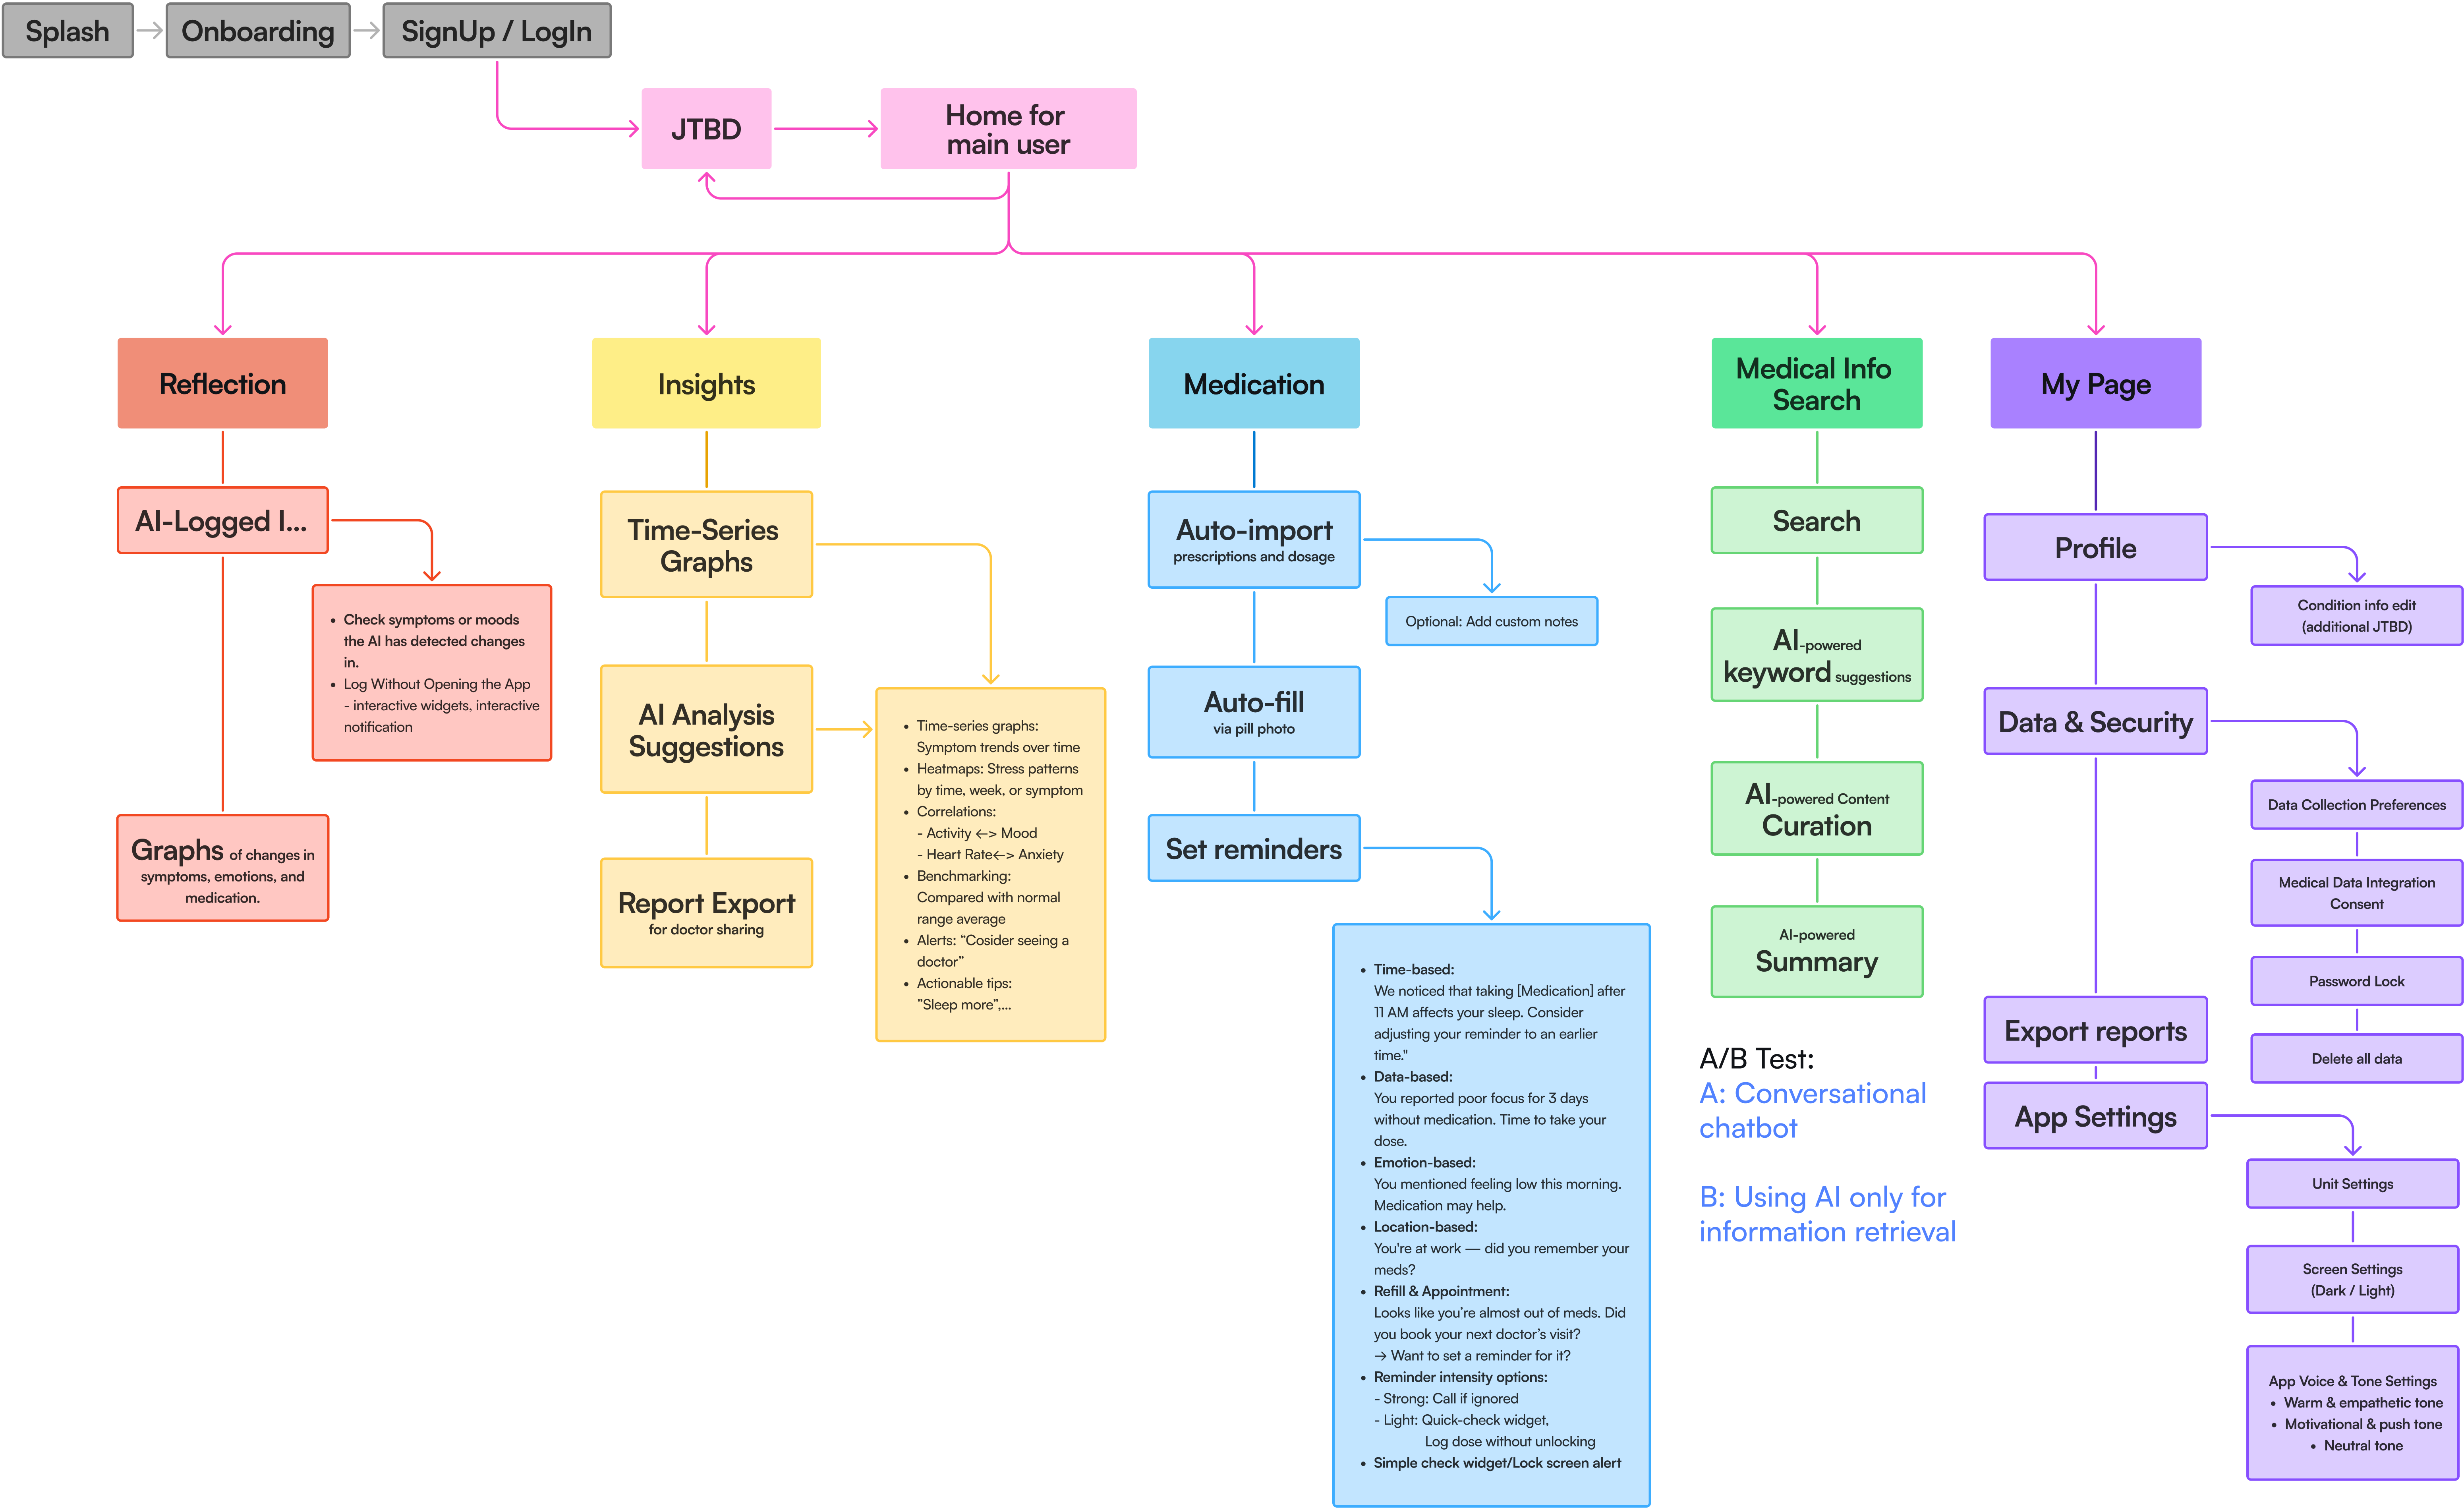
We conducted A/B testing to validate whether the flow we considered logically sound also felt natural to users in practice. Based on the results, we iterated toward the option that better aligned with users’ mental models and was easier to understand. To quantify the result, we used SUS analysis, achieving a score of 85.0 (Grade A).
Participants valued tracking what’s usually hard to measure
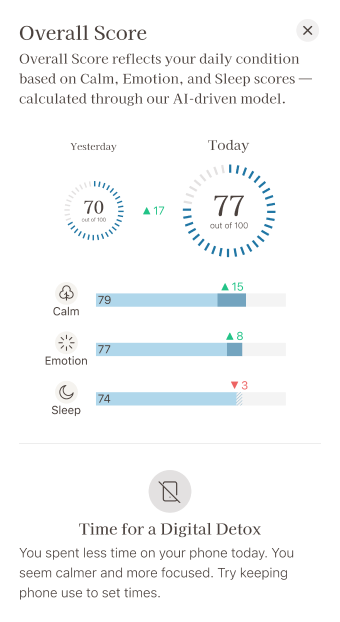
During usability testing, participants expressed that they highly value tracking "invisible" data, such as ambiguous feelings that are difficult to measure. While explicit scores can sometimes cause stress, presenting these subtle trends in a relatable way helps users recognise their progress.
We found a 'blind spot' where constant tracking becomes a psychological burden for some mental states.
Some participants noted that users with severe depression may find any daily activity overwhelming, while those with anxiety might find constant tracking obsessive.
Despite our initial focus on users sceptical of treatment, we identified a 'blind spot' where the app’s requirements could conflict with the user's mental state, suggesting a need for even more flexible interaction models.